After weeks of speculation, leaks, and briefings, Rachel Reeves was the first female Chancellor of the Exchequer to deliver a Budget Statement to the House of Commons. As expected, her speech was sombre, though intensely political – criticising the Conservative Party now in Opposition for what she repeatedly called their 14 years of failure and promising to “fix the foundations to deliver change”, especially in improvements in public services. The government’s Budget measures are predicted by the independent Office for Budget Responsibility to generate nearly £40bn in additional revenue in the 2025/26 tax year. We will be providing a more detailed analysis in due course but we have penned some initial thoughts on what was announced on our website, covering the following key areas: Non-dom reforms Inheritance Tax (IHT) Capital Gains Tax (CGT) UK Property
Weather-wise it wasn’t the greatest of summers, but then again it wasn’t the worst either. A sentiment that pretty much sums up the fortunes of London’s prime housing markets over the last three months. It’s been a stop and start summer dominated by political announcements. The announcement of a general election caused many would-be buyers and sellers to stop in their tracks. Followed six weeks later by the arrival of a new government, followed some three weeks later by the announcement a Budget planned for the end of October. People like to plan with a degree of certainty and there’s been a lot of uncertainty to deal with this summer.
ixed year for prime London sales market The prime London sales market recorded a poor month in August, even allowing for the usual summer holiday slowdown. On the back of a stronger July, transactions fell in August and value growth faltered. Looking beyond the data from a single month, which has often been volatile this year, the figures for the summer and the year-to-date suggest a more neutral picture in line with 2023 and 2017-2019 (pre-pandemic) trends. August saw 7.5% fewer sales transactions than a year earlier, which was 3.3% lower than the 2017-2019 (pre-pandemic average) August average. The year-to-date sales total for the first eight months of 2024 is 2.6% below last year. Under offer numbers have fared better and the year-to-date total is level with 2023. New sales instructions in August were 8.1% higher than a year earlier but 4.1% lower than the 2017-2019 August average. Stock on the market across prime London fell slightly from its June peak but the annual change was still positive at +11.9% for the end of August versus a year earlier, and 26.3% higher than at the end of August 2019 (five years earlier)
Positive sentiment is returning but remains fragile for prime London sales market July’s prime London sales data provided mixed messages, with values continuing their slow decline but transactions are picking up. Various factors are interacting and contributing to this uncertainty: the usual summer slowdown, a general election, plus volatility around the world both politically and in the financial markets.
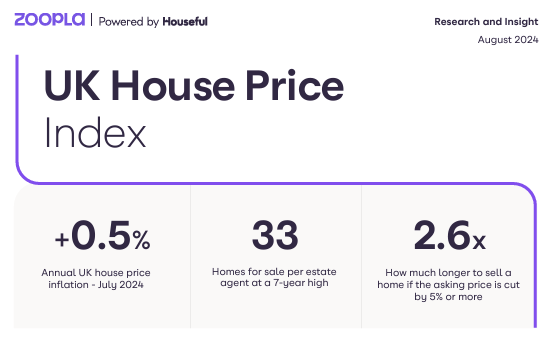
Executive summary 2.6x How much longer to sell a home if the asking price is cut by 5% or more • House prices are 1.4% higher over the first 7 months of 2024 having fallen over the final half of 2023 • All measures of activity are up year-on-year - the long-awaited base rate cut has not had a major impact on market activity so far • Price inflation has improved across all areas, remaining slightly negative in southern England but with London positive at 0.2% • 1 in 5 homes has had their asking price cut by 5% or more, an aboveaverage level showing continued price sensitivity amongst buyers • It takes 28 days to sell a home with no asking price reduction, but 73 days if you overprice and then need to reduce by 5% or more • House prices on track to be 2.5% higher over 2024 with 1.1m sales
Page 5 of 13
This website uses cookies to ensure you get the best experience on our website. More info